
SigNoz is a popular open source observability platform. It provides tooling to observe traces, logs, and metrics with the ability to set up alerts and create dashboards.
Using SigNoz with Apache APISIX is less trivial than using, say, Prometheus, which is supported through the out-of-the-box prometheus plugin. So, in this article, I will explain how to use SigNoz with APISIX for metrics.
SigNoz and OpenTelemetry
A key feature of SigNoz is that it is built on top of the OpenTelemetry standard. This means that tools and data formats using this standard can effectively work with SigNoz.
If APISIX supports exporting metrics in the OpenTelemetry standard format (OTLP), we can use it in SigNoz. But it doesn’t.
However, APISIX supports exporting metrics to Prometheus in the Prometheus format, which is meant to be scraped by Prometheus but could also be scraped by a Prometheus receiver in the OpenTelemetry Collector used by SigNoz.
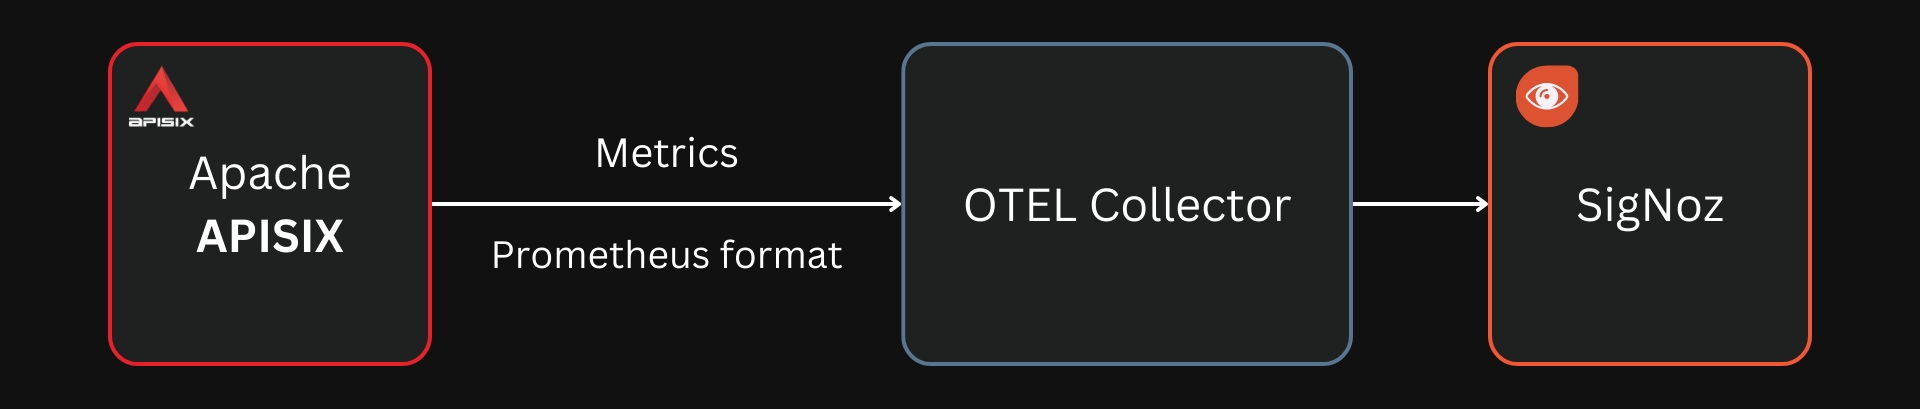
The OTEL Collector can be seen as a lightweight Prometheus here.
You can also use Prometheus instead of just the receiver for additional capabilities. But in this example, we are just interested in using SigNoz.

You can also use a full Prometheus instance to leverage its full capabilities.
Configuring APISIX
First, we have to configure APISIX to export metrics in Prometheus format:
plugins:
  - prometheus
  - public-api

plugin_attr:
  prometheus:
    export_uri: /metrics
    enable_export_server: false
This enables the prometheus and public-api plugins and exports the metrics to the /metrics path in the data plane port.
Note: SigNoz’s OpenTelemetry Collector always scrapes the
/metricsendpoint, which cannot be overridden.
You can also export the metrics to a separate server, as the documentation describes.
Next, you can enable the Prometheus plugin. I usually enable the plugin on all routes using a global rule:
global_rules:
  - id: 1
    plugins:
      prometheus:
        prefer_name: true
Finally, we must expose the /metrics path using the public-api plugin. You can enable this in a route as shown below:
routes:
  # export Prometheus metrics to the specified URI
  - uri: /metrics
    plugins:
      public-api:
Configuring SigNoz
You can instruct SigNoz (the OpenTelemetry Collector used by SigNoz) to scrape the endpoint exposed by APISIX for Prometheus metrics. To do this, you can modify the default Collector configuration file and add a new job to the receivers.prometheus.config.scrape_configs section:
receivers:
  prometheus:
    config:
      scrape_configs:
        - job_name: 'apisix'
          scrape_interval: 10s
          static_configs:
            - targets: ['apisix:9080']
              labels:
                instance: 'apisix'
You can then restart SigNoz, and the configuration will be in effect.
Viewing the Metrics
To see if everything works, open up the SigNoz web UI and create a new dashboard. In the metrics name dropdown, you will be able to search for and find metrics exported by APISIX:

See the documentation for specifying custom metrics.
You should also be able to import the APISIX Grafana dashboard to SigNoz, but there are issues with importing Grafana dashboards in SigNoz now.
Traces and Logs
A robust observability system is incomplete without traces and logs. You can also export these from APISIX to SigNoz through existing plugins.
To send logs, you can use the http-logger or the tcp-logger plugin to send the logs to the OpenTelemetry Collector used by SigNoz. For traces, APISIX comes with an opentelemetry plugin, which can export trace data to SigNoz.
You can also learn more about setting up an end-to-end monitoring system from this article and use a similar setup in SigNoz.
Thank you for reading "Exporting APISIX Metrics to SigNoz."
Subscribe via email or RSS feed to be the first to receive my content.
If you liked this post, check out my featured posts or learn more about me.