

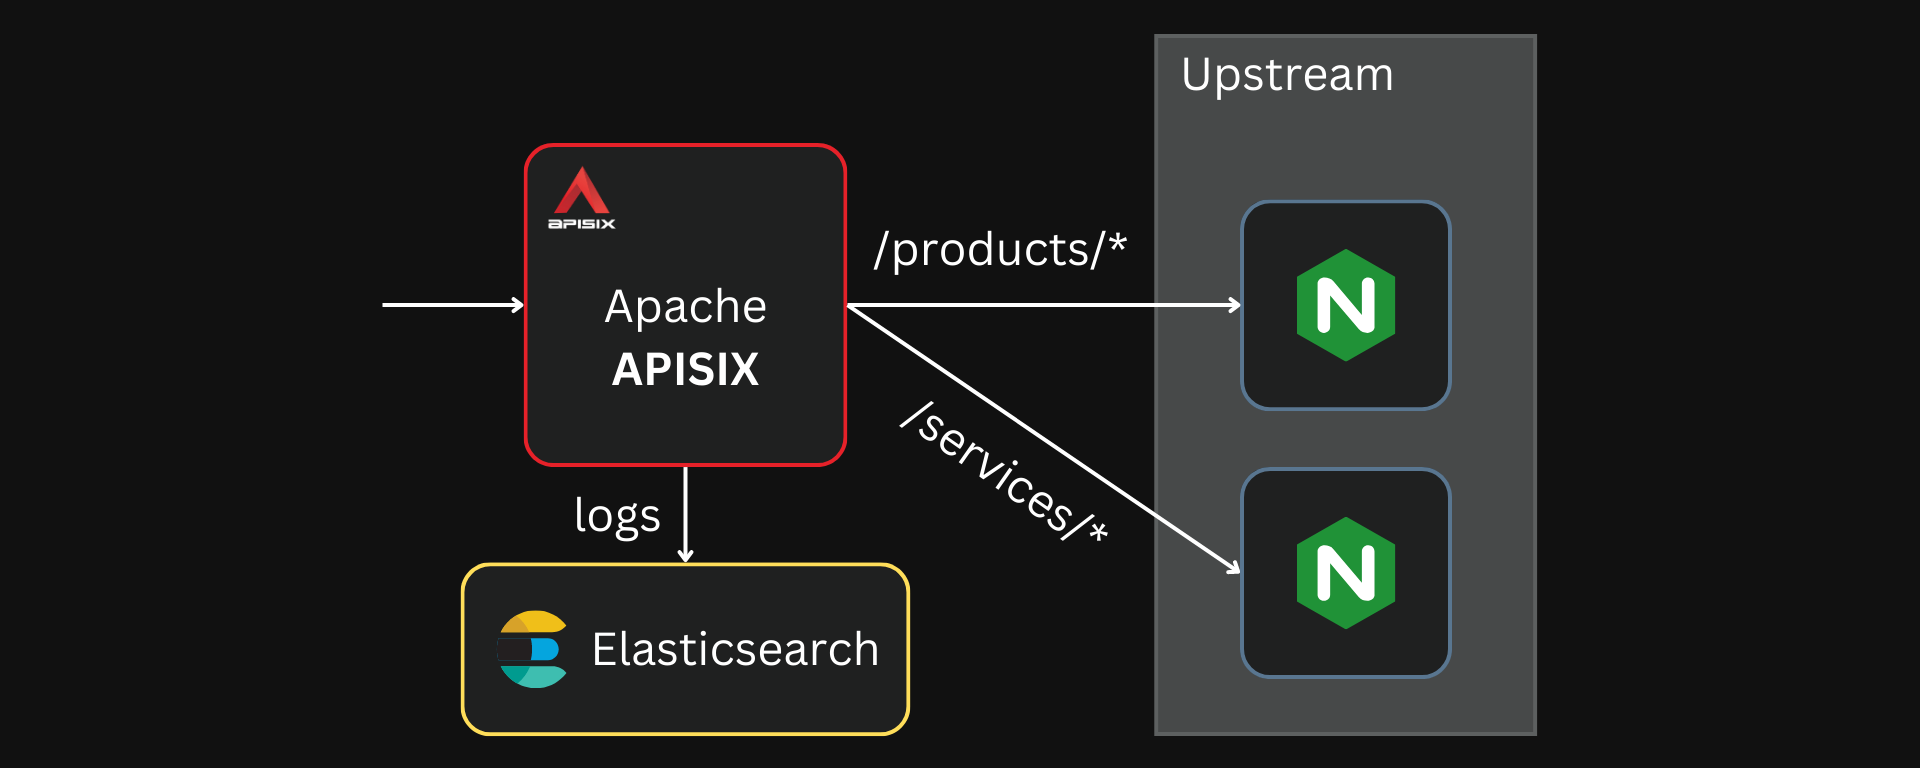
In most applications, Apache APISIX, the API gateway, sits in front of the backend services and acts as a single entry point. This allows application developers to use APISIX logs to provide insights into how their system and APISIX perform in real time.
Developers can also gather data from the logs and use it to improve the reliability and security of their applications. For example, data on the latency of different services can be used to identify issues and bottlenecks in your applications.
Additionally, these logs could also help handle some business-specific scenarios at the API gateway level, like user behavior analysis. However, it might not be as robust as event-driven trackers.
But gathering these logs and making them useful can be a difficult task. Even though I am a big fan of going through large log files using basic search tools, it often lacks trivial ways to search, filter, visualize, and gather insights needed to manage complex applications.
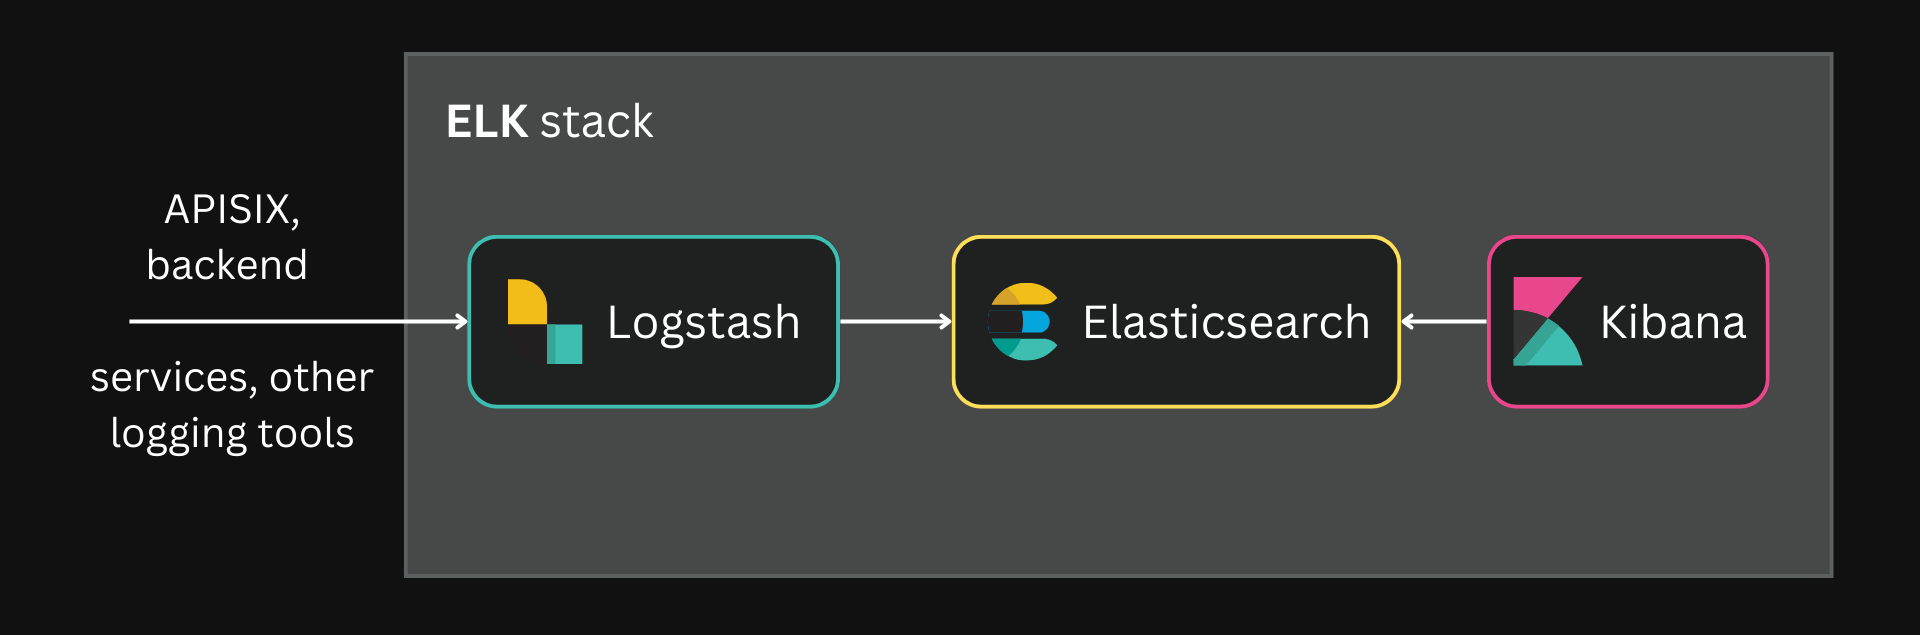
The Elastic (ELK) stack is a widely used observability stack for such applications. It primarily consists of three tools:
- Elasticsearch: A JSON-based datastore that stores and indexes data. In the ELK stack, it is used to store and search through large amounts of logs in real time.
- Logstash: A preprocessor for Elasticsearch that takes data from different sources, transforms it, and stores it in an external service (usually Elasticsearch in the ELK stack).
- Kibana: A web-based dashboard that lets you access, visualize, analyze (and more) the data built and indexed by Elasticsearch.
These tools can be used independently outside this particular stack but are tailored to work together.
Apache APISIX supports both these use cases out of the box through built-in plugins. This article will examine how you can configure these plugins in APISIX to work with the ELK stack. We will also look at how this system scales as applications get bigger.
The complete configuration used in this article can be found in this GitHub repository.
Forwarding Logs to Elasticsearch
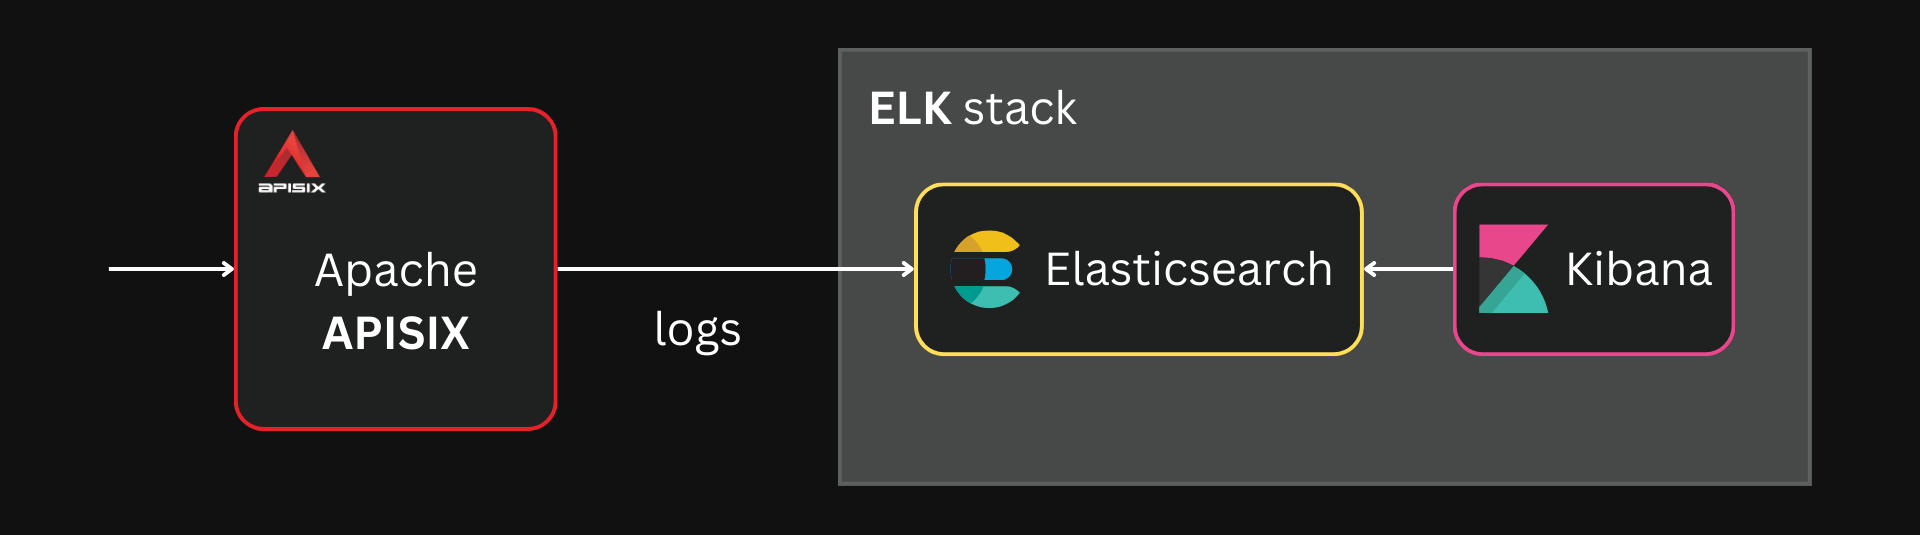
APISIX can directly forward logs to Elasticsearch through the elasticsearch-logger plugin. For this example, we will deploy APISIX, Elasticsearch, and our upstream applications (two Nginx containers).
See the GitHub repo for the complete Docker Compose file
The elasticsearch-logger plugin can be enabled globally by configuring it on a global rule:
curl localhost:9180/apisix/admin/global_rules/log_all -X PUT -d '
{
  "plugins": {
    "elasticsearch-logger": {
      "endpoint_addr": "http://elasticsearch:9200",
      "field": {
        "index": "gateway",
        "type": "logs"
      },
      "ssl_verify": false,
      "timeout": 60,
      "retry_delay": 1,
      "buffer_duration": 60,
      "max_retry_count": 0,
      "batch_max_size": 5,
      "inactive_timeout": 5
    }
  }
}'
NOTE
APISIX only supports ELK stack version 7.x. This article uses the version v7.17.1.
With the above configuration, all logs will be forwarded to Elasticsearch in batches of five. If we send a request to Elasticsearch, we can see that it builds an index with the received logs:
curl -X GET "http://127.0.0.1:9200/gateway/_search" | jq
{
  "took": 5,
  "timed_out": false,
  "_shards": {
    "total": 1,
    "successful": 1,
    "skipped": 0,
    "failed": 0
  },
  "hits": {
    "total": {
      "value": 13,
      "relation": "eq"
    },
    "max_score": 1,
    "hits": [
      {
        "_index": "gateway",
        "_type": "log",
        "_id": "mon0KooBf0okahNeFIxr",
        "_score": 1,
        "_source": {
          "upstream_latency": 5,
          "request": {
            "method": "GET",
            "url": "http://localhost:9080/products/washer",
            "uri": "/products/washer",
            "querystring": {},
            "size": 93,
            "headers": {
              "accept": "*/*",
              "user-agent": "curl/7.88.1",
              "host": "localhost:9080"
            }
          },
          "route_id": "routes#1",
          "client_ip": "172.20.0.1",
          "response": {
            "status": 200,
            "size": 190,
            "headers": {
              "content-length": "27",
              "content-type": "text/plain; charset=utf-8",
              "date": "Fri, 25 Aug 2023 04:29:08 GMT",
              "server": "APISIX/3.4.1",
              "connection": "close"
            }
          },
          "apisix_latency": 27.000064849854,
          "upstream": "172.20.0.5:80",
          "start_time": 1692937748072,
          "service_id": "",
          "server": {
            "version": "3.4.1",
            "hostname": "7f3bcc429d92"
          },
          "latency": 32.000064849854
        }
      }
    ]
  }
}
Analyzing the Logs with Kibana
Storing and indexing large volumes of logs is not useful on its own. That is why we will use Kibana to analyze and drive insights from these logs.
See the GitHub repo for the complete Docker Compose file
As mentioned, Kibana supports logs from Elasticsearch out-of-the-box. Once we deploy Kibana, we can go ahead and create an index pattern for the data we already have in Elasticsearch:
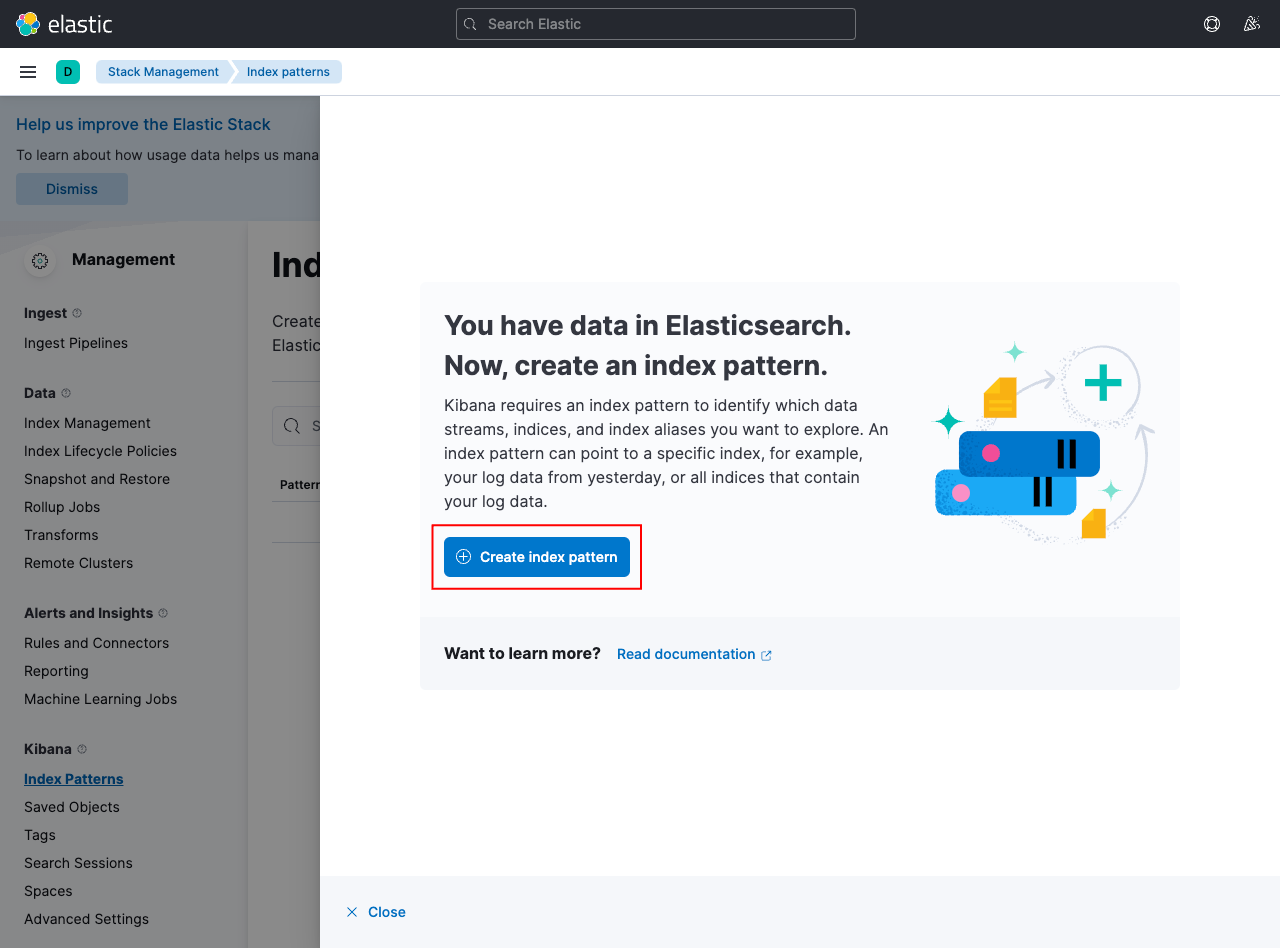
This should be available in /app/management/kibana/indexPatterns
We created the index “gateway” in Elasticsearch, and we can add a pattern to match this index:
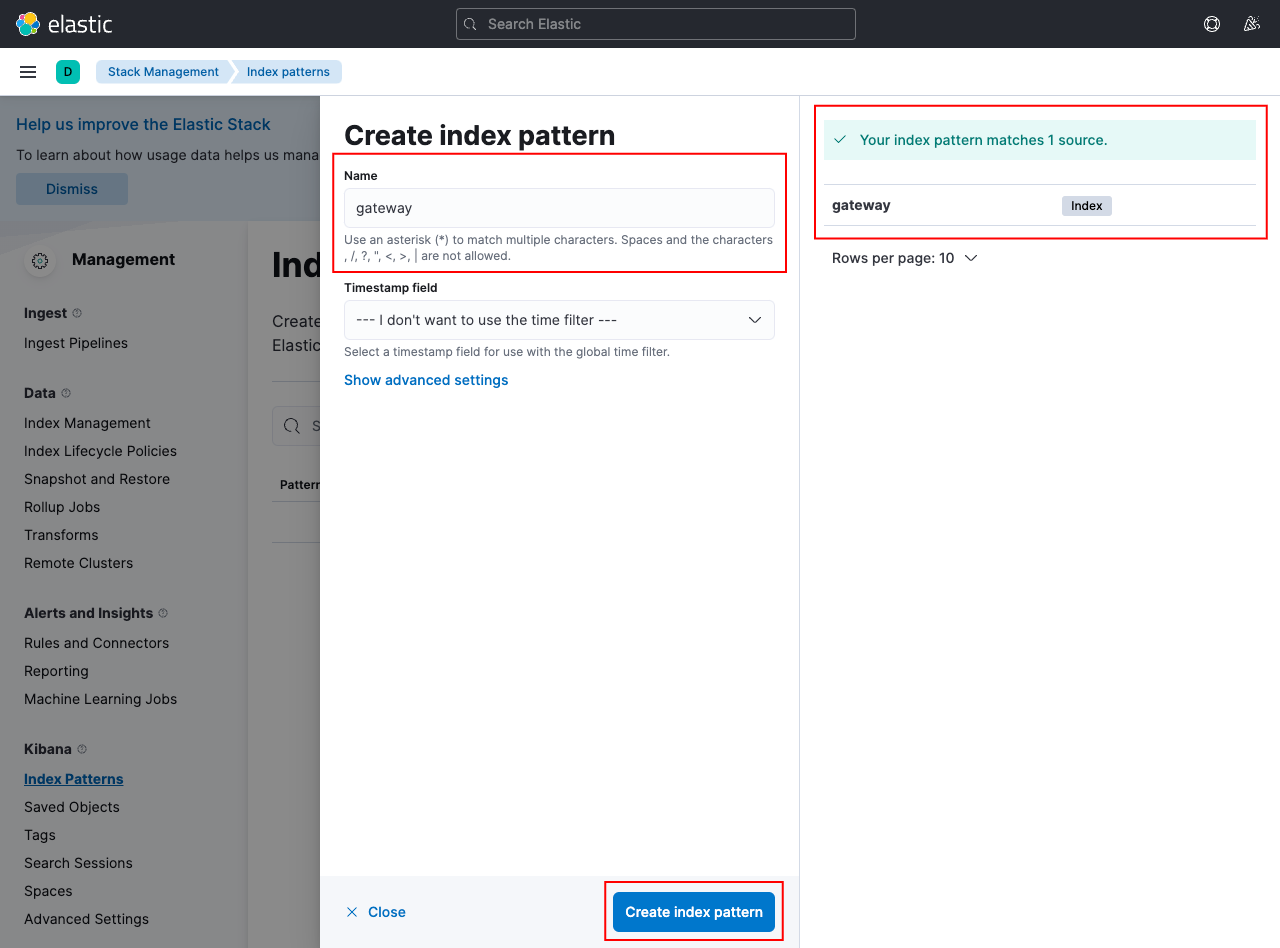
Learn more about index patterns from the official Kibana docs
Now, if you go back to the Discover page, you will be able to see the indexed logs from APISIX:
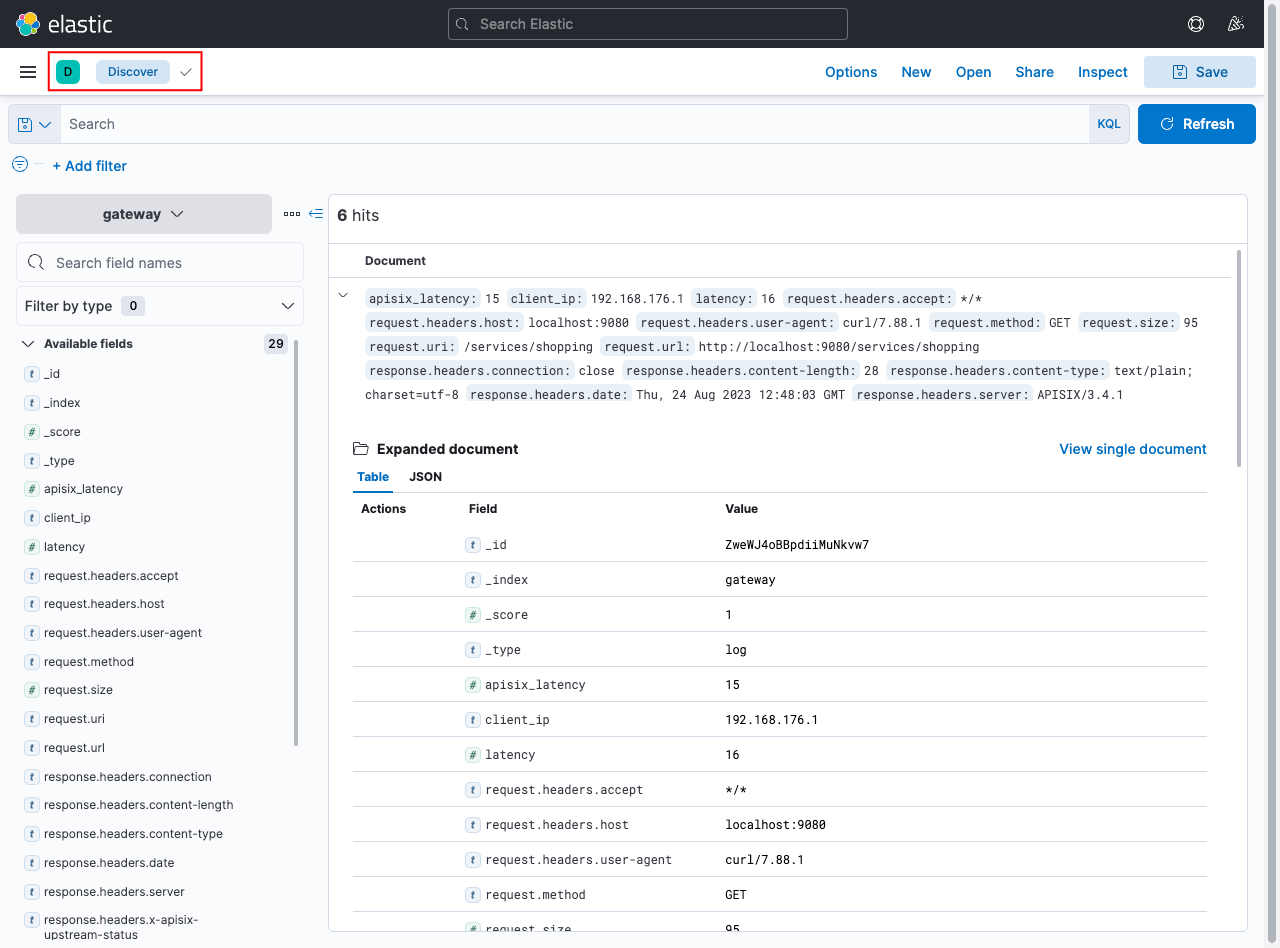
This should be available in /app/discover
You can search through these logs easily now and can create visualizations and dashboards or even use machine learning to find anomalies or security issues.
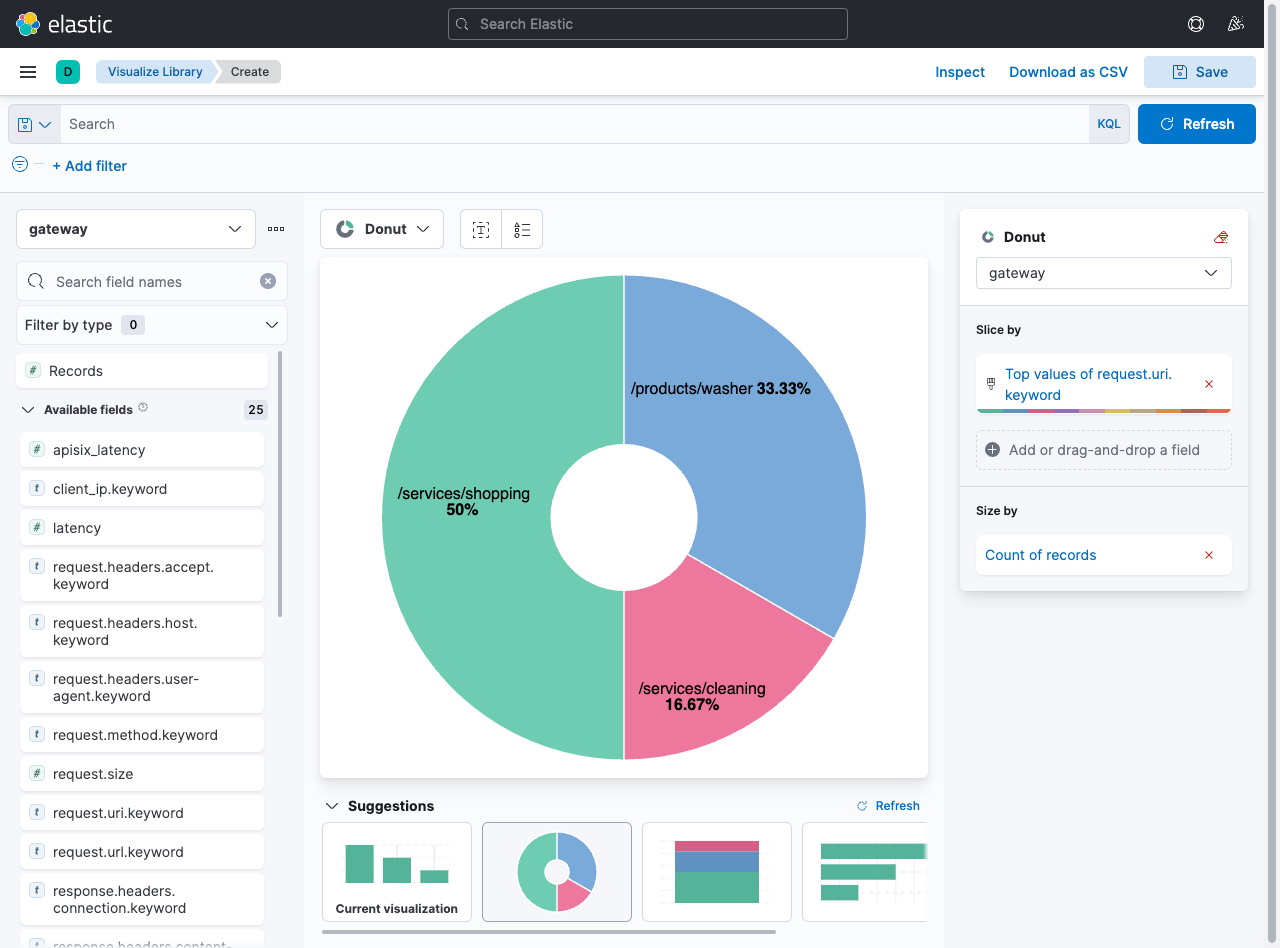
You can learn more about creating visualizations from the official Kibana docs
Customizing APISIX Logs
So far, we have not explicitly mentioned what should be logged from APISIX. But most of APISIX’s logger plugins, including the elasticsearch-logger plugin, support custom log formats.
To modify the logs, you can configure the log_format attribute in the plugin with key-value pairs representing the data to be logged, as shown below:
curl localhost:9180/apisix/admin/global_rules/log_all -X PUT -d '
{
  "plugins": {
    "elasticsearch-logger": {
      "endpoint_addr": "http://elasticsearch:9200",
      "field": {
        "index": "gateway",
        "type": "logs"
      },
      "ssl_verify": false,
      "timeout": 60,
      "retry_delay": 1,
      "buffer_duration": 60,
      "max_retry_count": 0,
      "batch_max_size": 5,
      "inactive_timeout": 5,
      "log_format": {
        "host": "$host",
        "timestamp": "$time_iso8601",
        "client_ip": "$remote_addr"
      }
    }
  }
}'
log_format supports custom APISIX and Nginx variables, as shown above. These variables can be used with the $ prefix.
Considering Scale and Performance
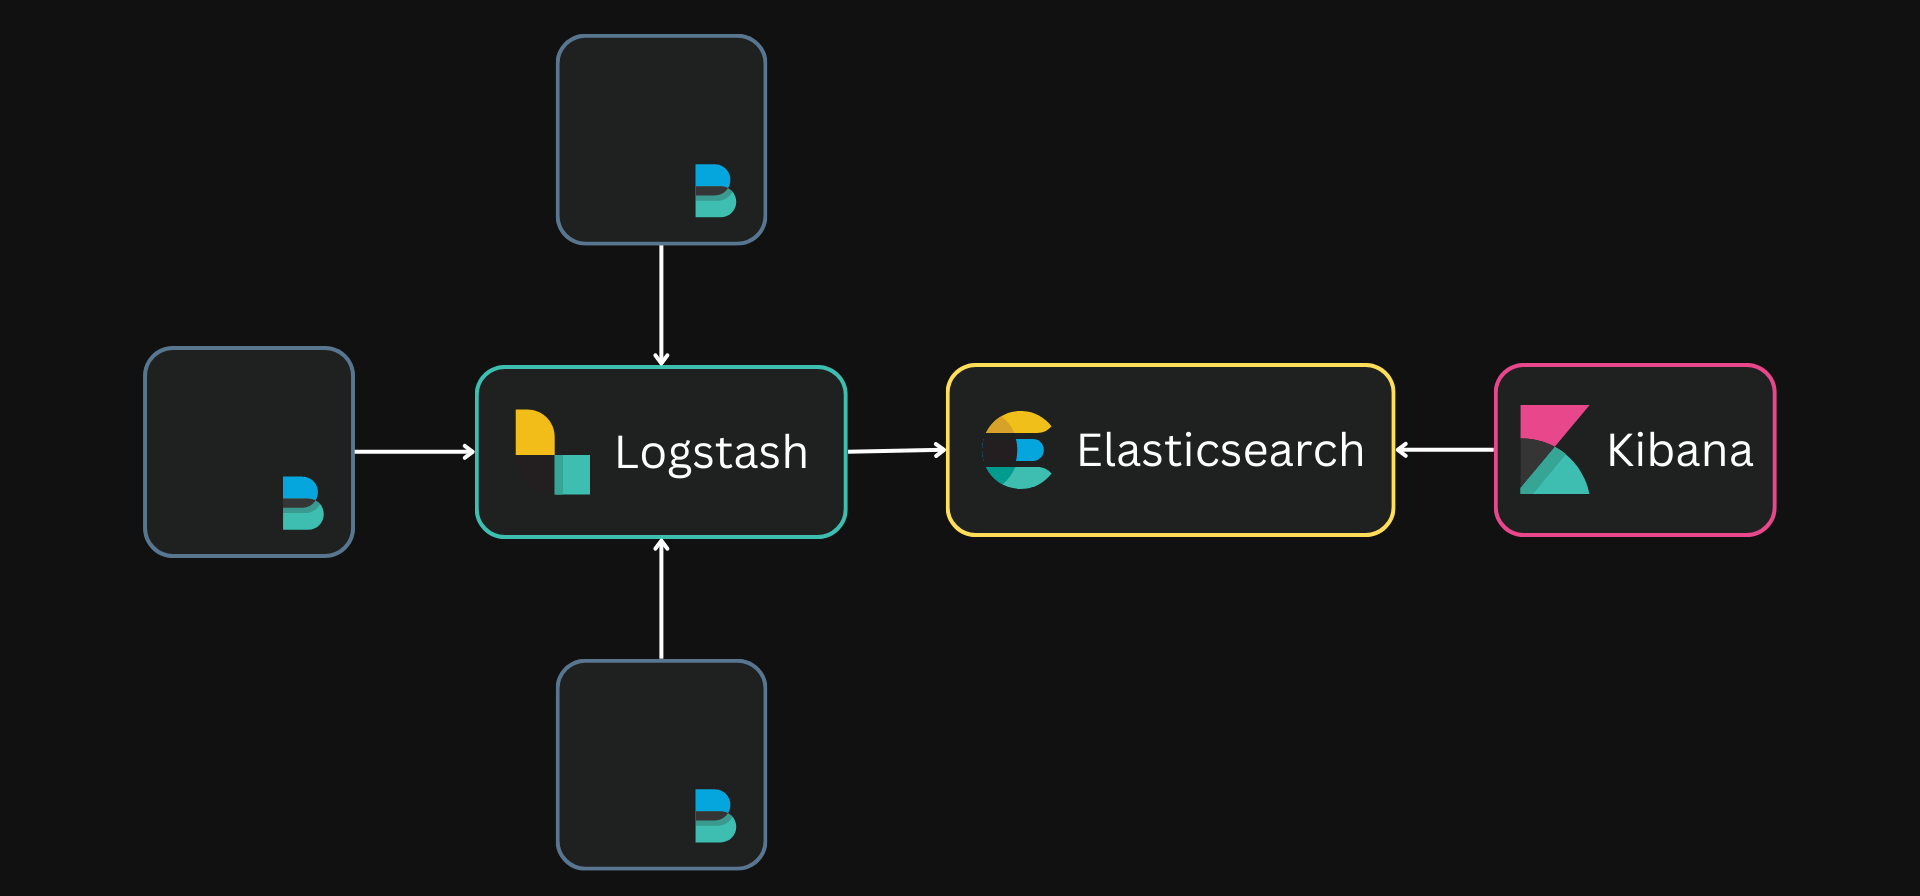
Most practical systems that require something like the ELK stack for storing and managing logs would be large and distributed. Such systems would have logs coming in from multiple different services and even multiple instances of the same service as opposed to our above examples that just focused on APISIX logs.
In such scenarios, a robust data pipeline should be built to collect, aggregate, and preprocess these logs before sending them to Elasticsearch. This is where the L in ELK, Logstash, comes in.
Logstash can collect data from multiple different sources through multiple different formats. Logstash can then use filters to transform and aggregate data into a standard format, which is often useful in large distributed systems for better analysis.
The ELK stack is widely used as the observability platform for large distributed systems
APISIX supports exporting logs through HTTP and TCP with the http-logger and tcp-logger plugins. Logstash can be configured to collect these logs and forward them to Elasticsearch after processing.
These plugins can be configured similarly to the elasticsearch-logger plugin. The example below shows how you can configure the http-logger plugin:
curl localhost:9180/apisix/admin/global_rules/log_all -X PUT -d '
{
  "plugins": {
    "http-logger": {
      "uri": "http://logstash:8080",
      "timeout": 60
    }
  }
}'
You can also use tools outside the ELK stack, like Apache Kafka, to build your data pipelines. This can be useful when handling high traffic fluctuations to reduce the load on Elasticsearch. Logstash can also achieve this, and it might work better because it is part of the ELK stack, and each tool in the stack is designed to be interoperable.
APISIX can directly export logs to a Kafka cluster using the kafka-logger plugin.
There is also another set of tools called Beats, which is also considered to be a part of the ELK stack (the BELK stack?). Beats are agents that can be deployed on different systems to ship data from these systems. Filebeat is such an agent that sends log files from servers to the rest of the ELK stack.
There are also other shippers available
APISIX can export logs to files with the file-logger plugin. However, using log files and Filebeat for exporting APISIX logs can result in reduced performance because of the frequent write cycles with the disk.
Going Further
We have only scratched the surface of how you can leverage the data from APISIX logs. But this depends solely on how you use APISIX within your system and your existing observability setup. You can learn more about using the ELK stack from the official website.
You can also use other observability tools if you don’t want to use the ELK stack or already use another stack. APISIX has logging plugins that directly export logs to tools and platforms like Apache SkyWalking, Splunk, and Google Cloud.